Bank Slippages in India: Meaning, Causes, and What They Signal for MSME and Retail Loan Books
Every quarterly earnings season, Indian banking analysts pore over one metric with particular intensity: the slippage number. Whether it is a large public sector lender reporting out of Mumbai or a mid-sized private bank with a heavy MSME exposure, bank slippages meaning causes India has become a critical area of focus for regulators, investors, and credit professionals alike. At its core, a slippage represents a loan account that has moved from the performing category into the non-performing category — a transition that carries significant implications for a bank's provisioning burden, capital adequacy, and ultimately, its profitability. With geopolitical tensions rising and macroeconomic headwinds building into FY27, analysts are increasingly flagging MSME and retail loan books as the most vulnerable segments. Understanding what slippages are, how they emerge, and how to interpret them is no longer optional knowledge for anyone serious about Indian banking.
What Are Slippages in Banking? A Plain-English Definition
In the most straightforward terms, a slippage in banking refers to the fresh addition to a bank's non-performing assets (NPAs) during a given reporting period — typically a quarter or a financial year. When a borrower fails to service their loan (principal or interest) for 90 consecutive days, that loan account "slips" from the standard asset category into the NPA category. The total value of all such accounts that crossed that threshold during the period constitutes the gross slippage figure for that period.
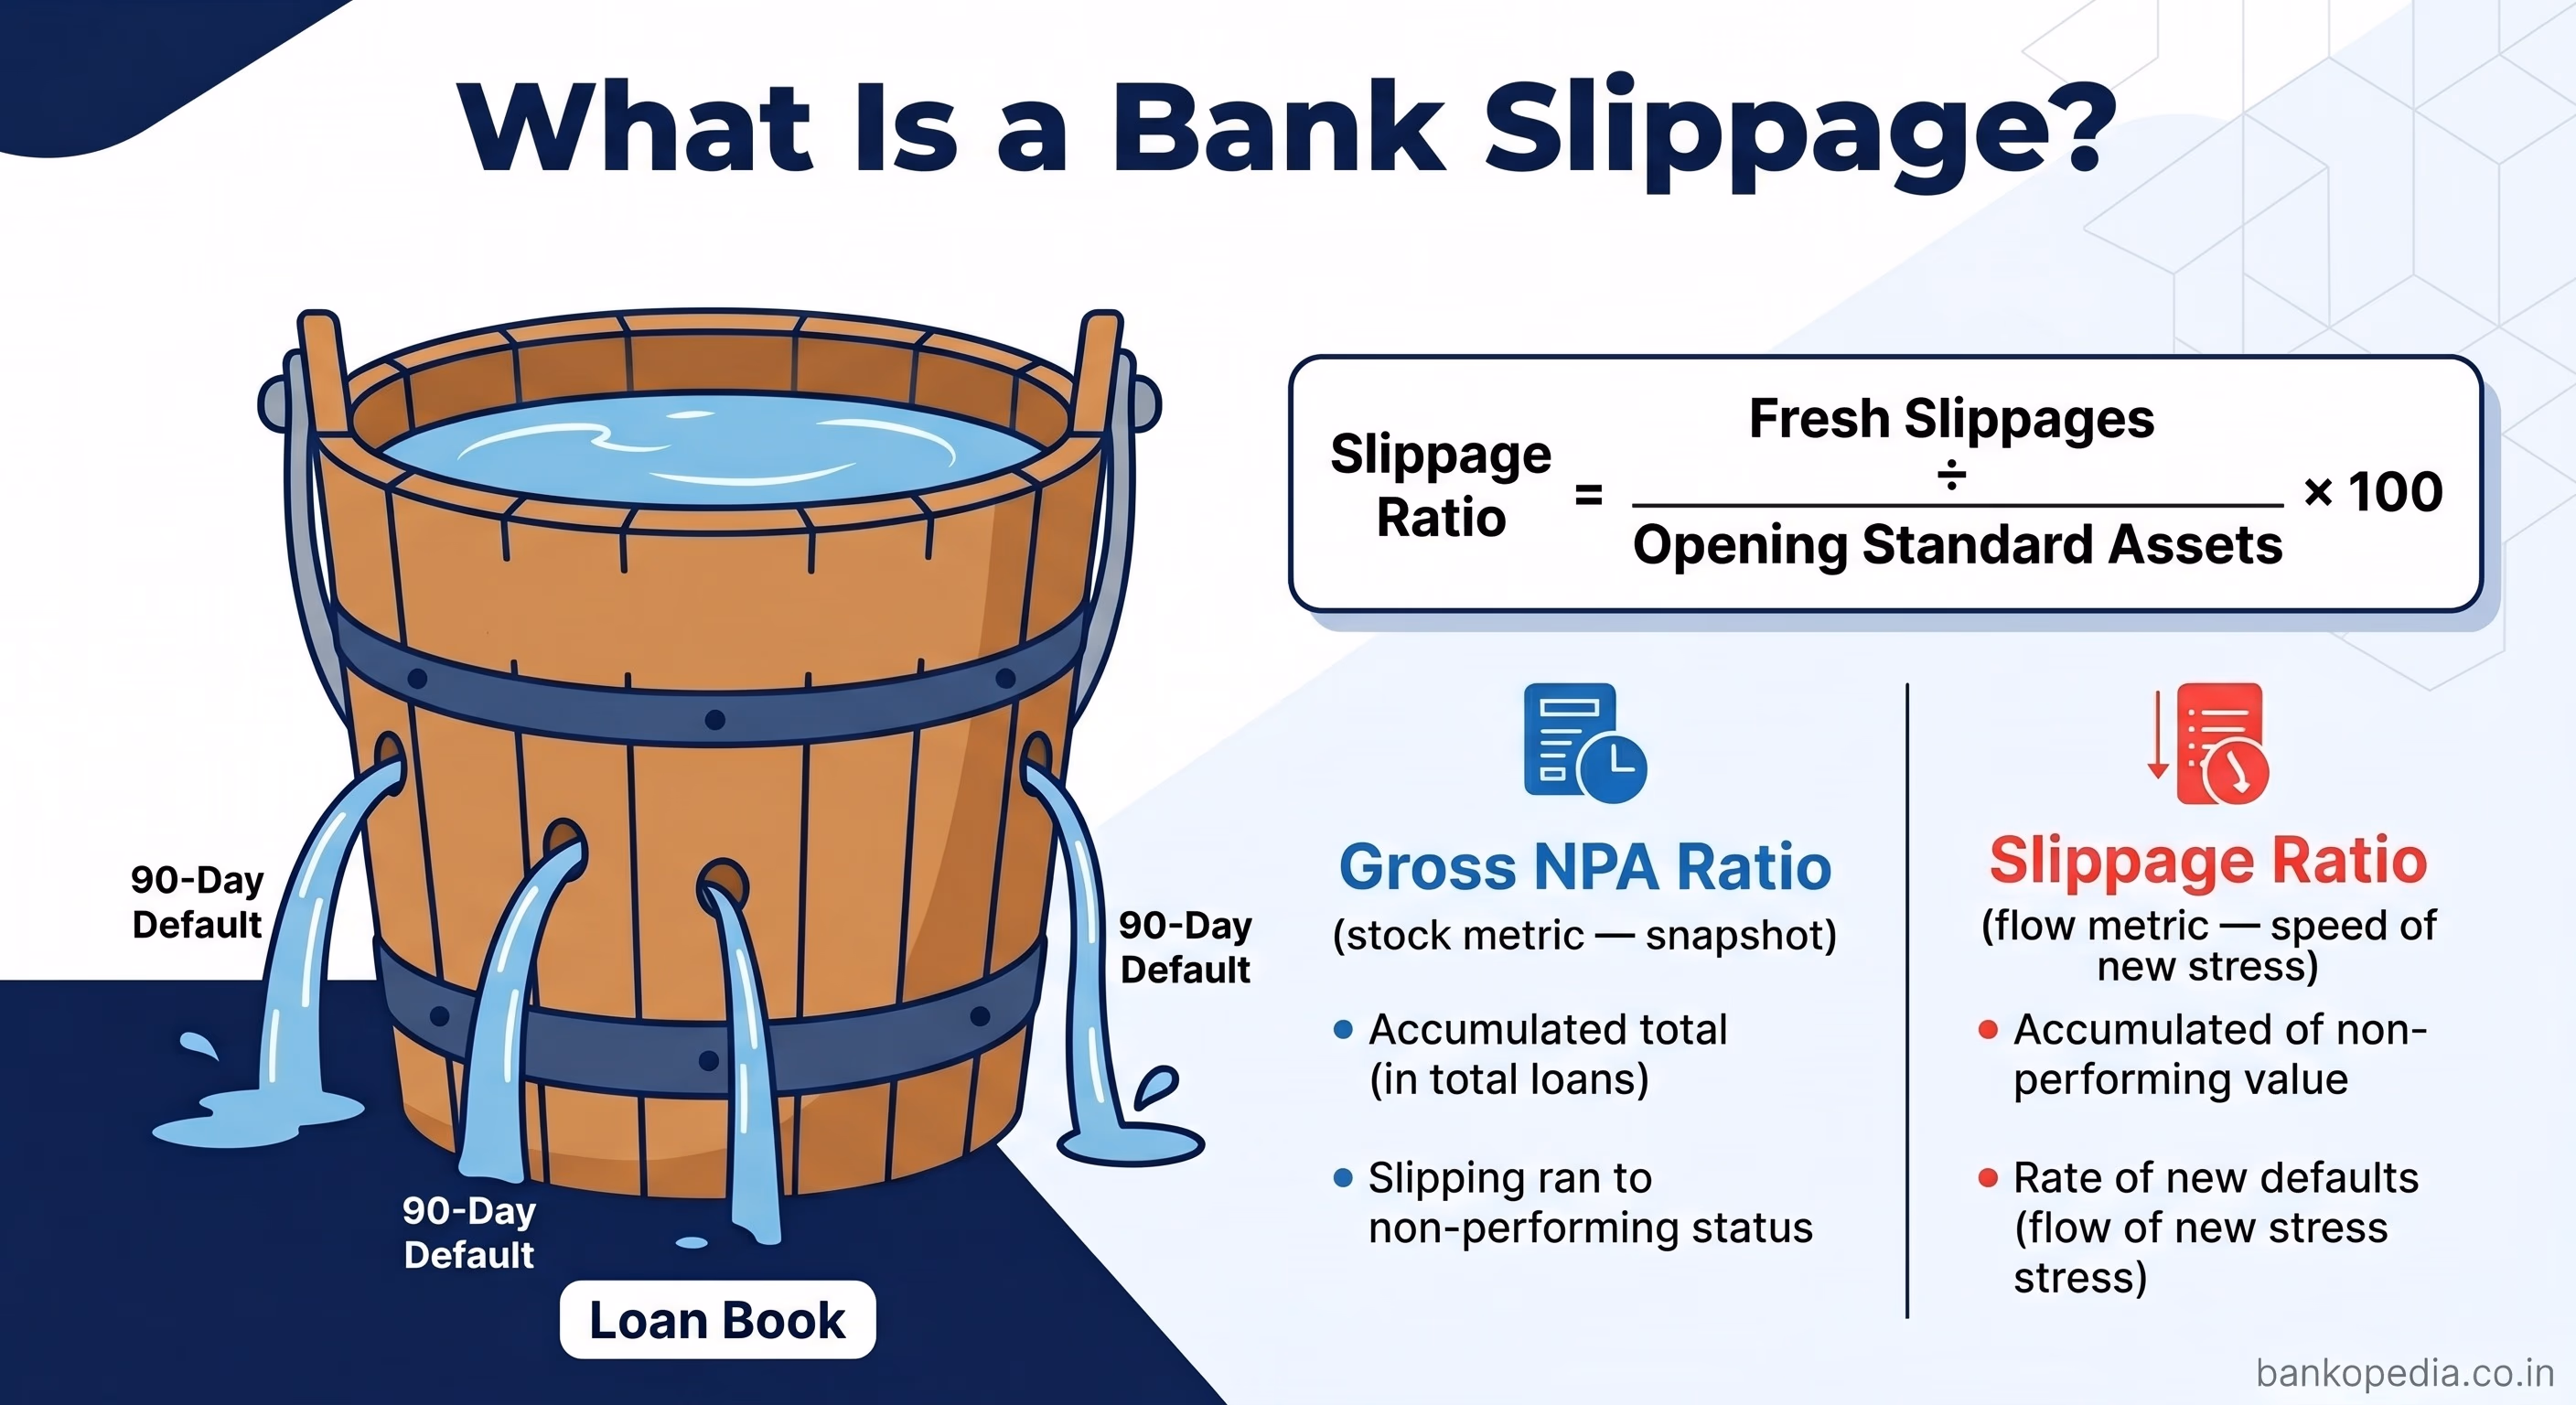
Think of it as a leaky bucket: the bucket is your loan book, and slippages are the holes that keep appearing. Even if a bank is aggressively recovering old NPAs or writing them off, new slippages continuously replenish the stock of stressed assets unless underlying credit quality is sound.
The slippage ratio is typically expressed as:
Slippage Ratio (%) = (Fresh Slippages During the Period ÷ Opening Standard Assets) × 100
A lower slippage ratio signals tighter underwriting standards and healthier borrower behaviour. A rising slippage ratio, particularly if it accelerates across two or three consecutive quarters, is a red flag that demands deeper investigation into sectoral or macroeconomic causes.
It is important to distinguish slippages from the gross NPA ratio. The gross NPA ratio is a stock figure — it tells you how much stress has accumulated on the balance sheet at a point in time. Slippages, by contrast, are a flow metric — they tell you how fast new stress is being created. A bank could have a seemingly stable gross NPA ratio while quietly experiencing elevated slippages, simply because aggressive write-offs or recoveries are masking the fresh inflows. This is why seasoned analysts always look at slippages independently.
The NPA Lifecycle: From Standard Asset to Loss Classification
To fully appreciate bank slippages, one must understand the full journey of a loan account through the Reserve Bank of India's asset classification framework. The RBI's Income Recognition, Asset Classification and Provisioning (IRACP) norms govern this journey precisely, and every commercial bank in India — whether scheduled or cooperative — must adhere to these guidelines.
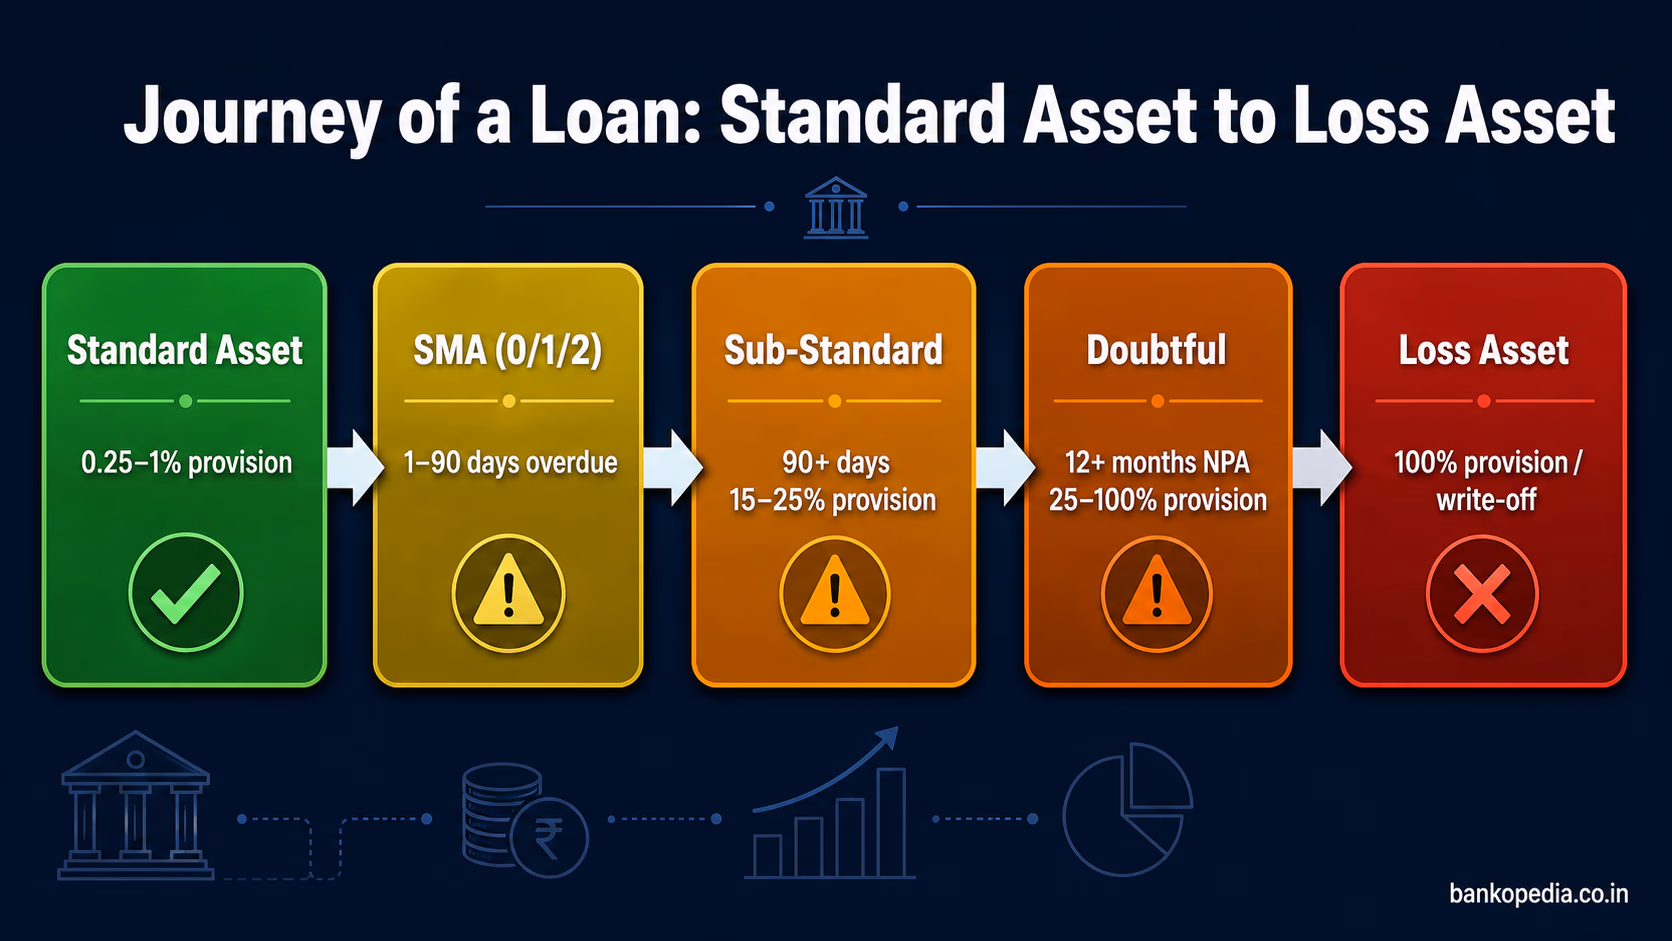
Stage 1: Standard Assets
A loan is classified as a standard asset when the borrower is servicing both principal and interest regularly and there is no reason to believe that the loan will default. Banks are required to maintain a general provision of 0.25% to 1% on standard assets depending on the category (agricultural loans, commercial real estate, and so on). Standard assets are the performing heart of any bank's portfolio.
Stage 2: Special Mention Accounts (SMA)
Before a loan formally becomes an NPA, it passes through the Special Mention Account (SMA) classification — a framework the RBI introduced to enable early identification of stress. The SMA sub-categories work as follows:
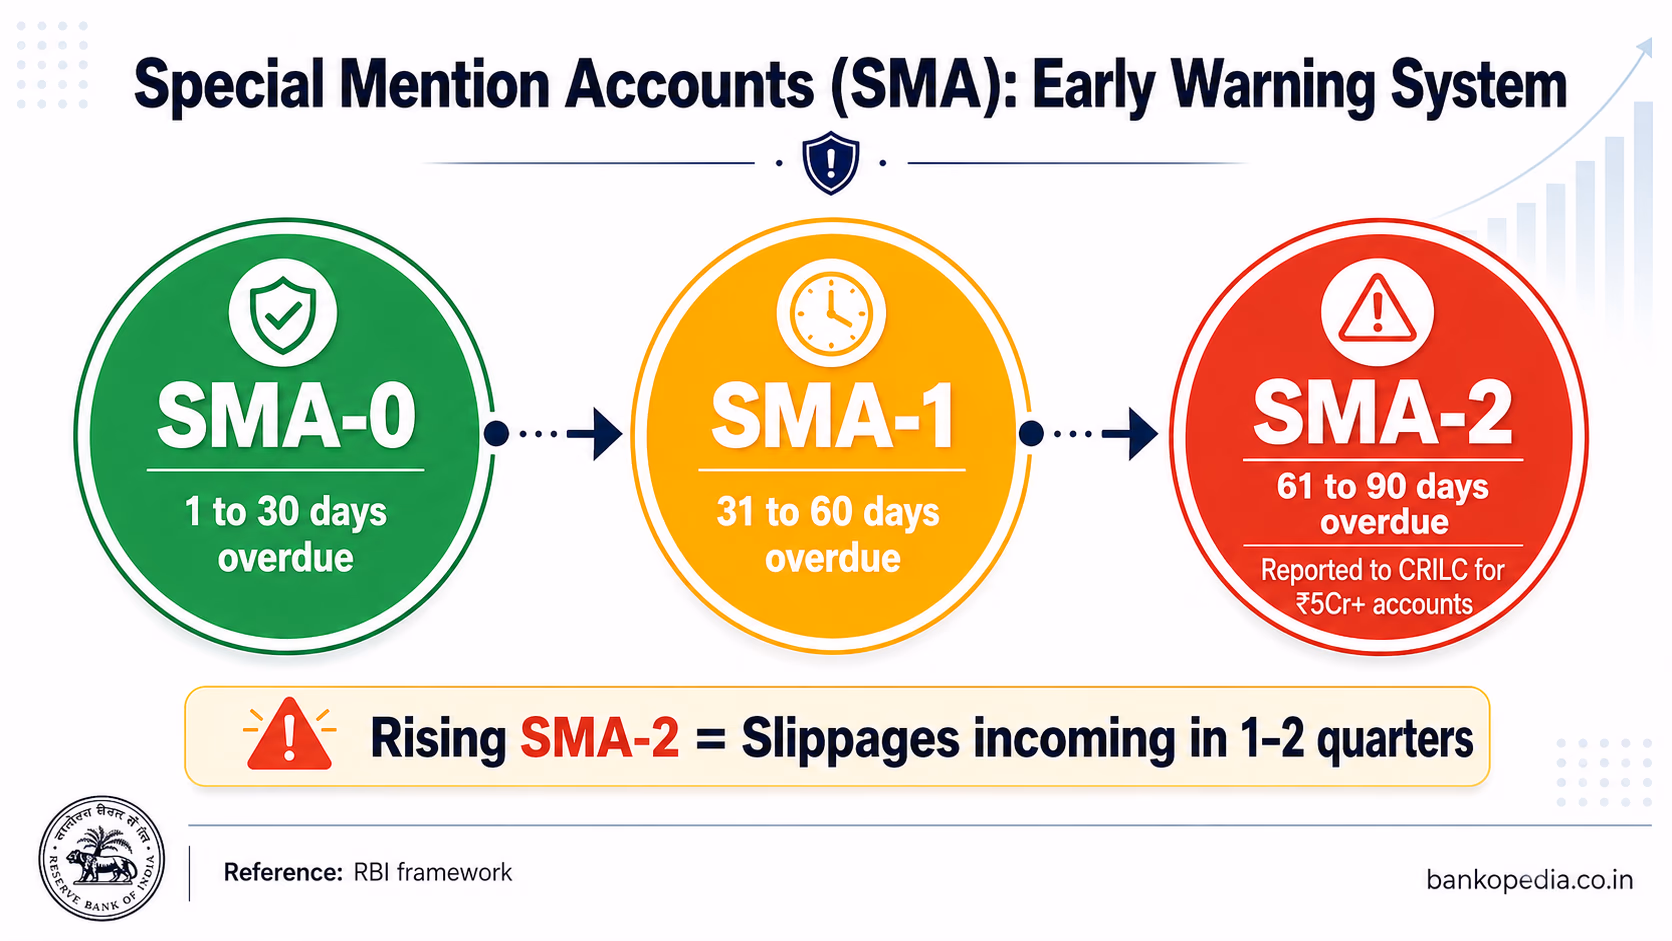
SMA-0: Principal or interest overdue for 1 to 30 days
SMA-1: Overdue for 31 to 60 days
SMA-2: Overdue for 61 to 90 days
Banks are required to report SMA-2 accounts to the Central Repository of Information on Large Credits (CRILC), managed by the RBI, for exposures of ₹5 crore and above. SMA-2 accounts are the clearest leading indicator of imminent slippages, and a rising SMA-2 pool in any bank's portfolio is a warning sign that cannot be ignored.
Stage 3: Sub-Standard Assets
Once a loan remains overdue for more than 90 days, it is classified as a Non-Performing Asset and specifically as a sub-standard asset for the first 12 months after it becomes NPA. At this stage, banks must provision 15% of the outstanding secured amount and 25% for the unsecured portion. This is the moment of slippage — the formal crossing of the 90-day threshold.
Stage 4: Doubtful Assets
If the account remains NPA for more than 12 months, it is reclassified as a doubtful asset. Provisioning requirements escalate sharply here, ranging from 25% to 100% of the secured outstanding depending on how long the account has remained doubtful, and 100% on the unsecured portion. Recovery prospects diminish significantly at this stage.
Stage 5: Loss Assets
A loss asset is one where the loan has been identified as uncollectable by the bank's internal auditors, the RBI's inspection teams, or the bank's own management. The entire outstanding amount must be fully provisioned. In practice, many banks prefer to write off loss assets to clean up their balance sheets, though the legal recovery process may continue.
This lifecycle underscores why early detection — particularly at the SMA stage — is so critical. Every account that slips to doubtful or loss status represents a compounding provisioning burden that directly erodes net interest margins and return on assets.
Why MSME and Retail Books Are Prone to Slippages During Economic Stress
Among all borrower segments, micro, small, and medium enterprises (MSMEs) and retail borrowers (including personal loans, credit cards, and vehicle loans) have historically demonstrated the highest sensitivity to economic disruptions. As India navigates an environment marked by geopolitical tensions, export slowdowns, and possible demand compression in FY27, these two segments are once again drawing regulatory and investor scrutiny.
The Structural Vulnerabilities of MSME Borrowers
MSMEs are the backbone of the Indian economy, contributing roughly 30% of GDP and employing over 110 million people. Yet their credit risk profile carries several structural weaknesses that make them disproportionately vulnerable during stress periods:
Thin capital buffers: Most MSMEs, particularly micro enterprises, operate with minimal equity cushions. A single quarter of revenue disruption — caused by a demand slump, supply chain breakdown, or export cancellation — can quickly render them unable to service debt.
Informal cash flows: MSME revenue streams are often partially informal, making it difficult for banks to get accurate early warning signals of financial deterioration before the 90-day clock starts ticking.
Collateral quality concerns: While many MSME loans are secured against property or machinery, the realisable value of such collateral in a distressed market is often significantly lower than book value, amplifying loss given default (LGD) for banks.
Concentration in vulnerable sectors: A large proportion of MSME credit is deployed in sectors such as textiles, gems and jewellery, leather goods, and small-scale manufacturing — sectors acutely exposed to global trade disruptions and geopolitical shocks.
Dependence on government support schemes: MSME loan books swelled significantly after the Emergency Credit Line Guarantee Scheme (ECLGS) was introduced during the COVID-19 pandemic. As ECLGS support winds down and moratorium effects fully work through the system, latent stress in ECLGS-originated portfolios continues to surface as slippages.
NABARD, which plays a critical role in refinancing rural and agricultural credit, has also flagged the overlapping stress between agri-allied MSMEs and the broader rural credit ecosystem, particularly in states where farm income volatility interacts with small enterprise health.
Why Retail Loan Books Are Not Immune
The rapid expansion of retail credit in India over the past five years — driven by digital lending, buy-now-pay-later products, personal loans, and unsecured credit card advances — has created a new layer of slippage risk that did not exist at the same scale a decade ago.
Unsecured exposure growth: Banks and NBFCs aggressively grew unsecured personal loan and credit card portfolios between FY21 and FY24. The RBI responded by raising risk weights on consumer credit in November 2023 precisely because of concerns about overextension. Unsecured loans, by definition, carry higher slippage risk during income shocks since there is no collateral to moderate loss severity.
Multiple leveraging: Credit bureau data increasingly shows that a growing proportion of retail borrowers carry obligations across three or more lenders simultaneously. This layering of debt means that any income disruption — a job loss, medical emergency, or EMI burden exceeding repayment capacity — triggers simultaneous slippages across multiple institutions.
Rural and semi-urban retail stress: Microfinance institution (MFI) portfolios, which largely cater to women borrowers in rural and semi-urban geographies, saw significant slippage spikes in FY24 and early FY25, reflecting over-indebtedness in certain pockets. While MFI slippages do not directly appear on bank balance sheets, banks with heavy MFI on-lending exposures or co-lending arrangements absorb indirect stress.
Cyclical employment sensitivity: Salaried retail borrowers — particularly those in export-oriented industries, IT/ITeS, and manufacturing — face layoff or salary-cut risks during global downturns. A geopolitically driven global slowdown in FY27 could translate into domestic employment stress, feeding retail slippages with a 2-3 quarter lag.
The Geopolitical Dimension for FY27
The current geopolitical environment adds a particularly complex overlay. Escalating trade tensions, supply chain realignments, and potential commodity price shocks can simultaneously squeeze MSME margins (through input cost inflation) and compress retail borrower incomes (through employment disruption in export sectors). Analysts tracking Indian bank earnings have begun revising slippage estimates upward for MSME-heavy lenders and banks with large unsecured retail books, reflecting this macro uncertainty.
How to Interpret Slippage Ratios When Analysing Indian Bank Stocks
For investors and banking professionals evaluating Indian bank stocks, slippage ratios are among the most actionable metrics available. But like all financial metrics, they require context and careful interpretation.
What Constitutes a "Normal" Slippage Ratio?
There is no universal benchmark, but as a general guide:
A slippage ratio below 1.5% annualised is typically considered healthy for large, diversified Indian banks with strong underwriting capabilities.
A ratio between 1.5% and 2.5% warrants monitoring, particularly if it is trending upward.
A ratio above 2.5% — especially if sustained over two or more quarters — signals material credit quality deterioration and usually prompts rating agency scrutiny and regulatory attention.
Segment-Level Disaggregation Matters
An aggregate slippage ratio can mask divergent trends within a bank's portfolio. Always try to obtain segment-level slippage data — separately for corporate, MSME, agri, and retail — from management commentaries and investor presentations. A bank with a 1.8% overall slippage ratio might look acceptable until you discover that its MSME book is slipping at 4%, with the figure being averaged down by a stable corporate book.
Compare Slippages Against Credit Costs
Rising slippages inevitably feed through to higher credit costs (provisions as a percentage of average advances). If a bank's slippage ratio is rising but credit costs remain flat, it likely means the bank is under-provisioning — a situation that will eventually require a catch-up, often coinciding with a sharp quarterly earnings miss. Conversely, a bank that proactively provisions ahead of slippage recognition (sometimes called "prudential provisioning") is building a buffer that can be released to support earnings in better times.
Track the SMA Pool as a Forward Indicator
Since SMA-2 accounts are the direct reservoir from which slippages emerge, tracking disclosures about the SMA pool — where available — gives analysts a 1-2 quarter lead time. Some Indian banks disclose SMA data voluntarily in their investor presentations; the RBI's Financial Stability Reports also provide system-level SMA trends. A rising SMA-2 pool today almost always translates into higher slippages two quarters hence.
Adjust for Write-Offs and Recoveries
When comparing slippage ratios across banks, be aware that banks with aggressive write-off policies may show lower gross NPA ratios but similar or higher underlying slippage trends. Always cross-check the net slippage figure (gross slippages minus recoveries and upgrades) for a cleaner picture of actual credit quality movement.
Regulatory and Rating Agency Benchmarks
The RBI's annual Report on Trend and Progress of Banking in India provides system-level slippage data segmented by bank group and sector, offering a useful benchmark against which individual bank performance can be assessed. SEBI's disclosure requirements for listed banks also mandate that material NPA developments be reported promptly, making stock exchange filings another valuable source of slippage intelligence.
Conclusion: Why Slippages Deserve Permanent Space in Your Banking Toolkit
Bank slippages are not a peripheral metric reserved for credit analysts in back offices. They are a real-time pulse reading of the health of India's lending ecosystem — a leading indicator of provisioning pressures, earnings volatility, and, in extreme cases, systemic financial stress. As FY27 approaches with a complex mix of geopolitical uncertainty, global trade headwinds, and domestic credit cycle maturation, the MSME and retail segments of Indian bank balance sheets deserve especially careful monitoring.
For investors, the discipline of tracking slippage ratios — disaggregated by segment, benchmarked against credit costs, and cross-referenced with SMA pool disclosures — can mean the difference between identifying a banking franchise with durable earning power and inadvertently holding a stock sitting on a deteriorating credit book. For banking professionals, understanding the structural drivers of MSME and retail slippages is essential to designing smarter underwriting criteria, more responsive early-warning systems, and more calibrated provisioning strategies.
The RBI's regulatory architecture — from IRACP norms to CRILC reporting to the Prompt Corrective Action framework — provides a robust scaffolding for managing slippage risk at the system level. But granular, analytical vigilance at the institution level remains irreplaceable. In Indian banking, as in most financial endeavours, the ability to read the early signals of stress — before they compound into crisis — is what separates sound stewardship from reactive damage control.